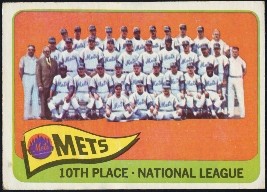
The 1965 New York Mets

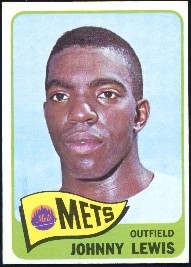
Rounding Third Hitter of the Year Johnny Lewis

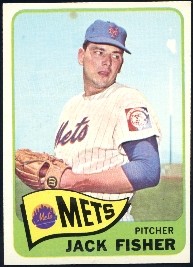
Rounding Third Pitcher of the Year Jack Fisher

50-112, 10th place in National League

back to Seasons - back to the New York Mets Hall of Records home page - Rounding Third baseball card shop

 
BATTING RECORD
(team leaders in red)

PLAYER              G   AB   R    H  2B 3B  HR RBI   TB SB CS   SO  BB HBP SAC SF  OBP  SLG  AVG
================================================================================================
Greg Goossen       11   31   2    9   0  0   1   2   12  0  0    5   1   0   0  0 .313 .387 .290
Ed Kranepool      153  525  44  133  24  4  10  53  195  1  4   71  39   2   1  8 .303 .371 .253
Joe Christopher   148  437  38  109  18  3   5  40  148  4  4   82  35   6   4  4 .311 .339 .249
Johnny Lewis      148  477  64  117  15  3  15  45  183  4  7  117  59   3   4  1 .331 .384 .245
Charley Smith     135  499  49  122  20  3  16  62  196  2  1  123  17   4   7  4 .273 .393 .244
------------------------------------------------------------------------------------------------
Roy McMillan      157  528  44  128  19  2   1  42  154  1  0   60  24   4  16  2 .280 .292 .242
Ron Hunt           57  196  21   47  12  1   1  10   64  2  7   19  14   6   6  1 .309 .327 .240
Jesse Gonder       53  105   6   25   4  0   4   9   41  0  0   20  11   0   0  1 .308 .390 .238
Chuck Hiller      100  286  24   68  11  1   5  21   96  1  1   24  14   1   1  1 .275 .336 .238
Jim Hickman       141  369  32   87  18  0  15  40  150  3  1   76  27   2   1  1 .291 .407 .236
------------------------------------------------------------------------------------------------
Ron Swoboda       135  399  52   91  15  3  19  50  169  2  3  102  33   3   1  2 .291 .424 .228
Yogi Berra          4    9   1    2   0  0   0   0    2  0  0    3   0   0   0  0 .222 .222 .222
John Stephenson    62  121   9   26   5  0   4  15   43  0  1   19   8   0   2  0 .264 .355 .215
Bobby Klaus       119  288  30   55  12  0   2  12   73  1  6   49  45   1   3  0 .302 .253 .191
Chris Cannizzaro  114  251  17   46   8  2   0   7   58  0  2   60  28   2   3  0 .270 .231 .183
------------------------------------------------------------------------------------------------
Billy Cowan        82  156  16   28   8  2   3   9   49  3  2   45   4   1   1  0 .205 .314 .179
Kevin Collins      11   23   3    4   1  0   0   0    5  0  1    9   1   0   0  0 .208 .217 .174
Gary Kolb          40   90   8   15   2  0   1   7   20  3  0   28   3   0   0  1 .191 .222 .167
Hawk Taylor        25   46   5    7   0  0   4  10   19  0  0    8   1   0   0  1 .167 .413 .152
Cleon Jones        30   74   2   11   1  0   1   9   15  1  0   23   2   0   0  0 .171 .203 .149
------------------------------------------------------------------------------------------------
Dan Napoleon       68   97   5   14   1  1   0   7   17  0  0   23   8   2   0  1 .222 .175 .144
Jimmy Schaffer     24   37   0    5   2  0   0   0    7  0  0   15   1   0   0  0 .158 .189 .135
Bud Harrelson      19   37   1    4   1  1   0   0    7  0  0   11   2   0   0  0 .154 .189 .108
================================================================================================
HITTERS TOTALS   1836 5081 475 1153 197 26 107 450 1723 28 40  992 377  37  50 28 .284 .339 .227
PITCHERS TOTALS   489  360  20   49   6  1   0  10   57  0  2  137  15   2  26  0 .175 .158 .136
================================================================================================
TEAM TOTALS      2325 5441 495 1202 203 27 107 460 1780 28 42 1129 392  39  76 28 .277 .327 .221


OPS+  bWAR    HoY
=================
 101   0.1   2.23
  94   0.3  28.71
  88  -0.6  24.17

 106   2.4  38.79
  90   2.1  26.18
-----------------
  65   0.6   6.21
  94   0.0   6.47
 100   0.1   8.32
  75  -0.3   8.84
  99   0.7  27.00
-----------------
 103   1.6  31.25
  29  -0.1  -0.41
  77   0.0   3.61
  62   0.1   3.27
  46   1.0  -3.36
-----------------
  47  -0.7  -2.86
  23   0.0  -1.84
  19  -0.9  -4.47
  61  -0.3   0.31
   7  -0.6  -5.57
-----------------
  16  -0.8  -5.72
   0  -0.6  -3.44
  -2  -0.5  -3.47
=================


PITCHING RECORD
(team leaders in red)

PITCHER              G  GS CG     IP  W   L   PCT    H   R  ER  SO  BB ShO SV   ERA
===================================================================================
Dennis Musgraves     5   1  0   16.0  0   0  ----   11   2   1  11   7   0  0  0.56
Darrell Sutherland  18   2  0   48.0  3   1  .750   33  16  15  16  17   0  0  2.81
Frank Lary          14   7  0   57.1  1   3  .250   48  24  19  23  16   0  1  2.98
Rob Gardner          5   4  0   28.0  0   2  .000   23  13  10  19   7   0  0  3.21
Tug McGraw          37   9  2   97.2  2   7  .222   88  47  36  57  48   0  1  3.32
-----------------------------------------------------------------------------------
Dick Selma           4   4  1   26.2  2   1  .667   22  11  11  26   9   1  0  3.71
Gordon Richardson   35   0  0   52.1  2   2  .500   41  27  22  43  16   0  2  3.78
Dennis Ribant       19   1  0   35.1  1   3  .250   29  16  15  13   6   0  3  3.82
Jack Fisher         43  36 10  253.2  8  24  .250  252 121 111 116  68   0  1  3.94
Dave Eilers         11   0  0   18.0  1   1  .500   20  11   8   9   4   0  2  4.00
-----------------------------------------------------------------------------------
Carl Willey         13   3  1   28.0  1   2  .333   30  13  13  13  15   0  0  4.18
Jim Bethke          25   0  0   40.0  2   0 1.000   41  24  19  19  22   0  0  4.28
Al Jackson          37  31  7  205.1  8  20  .286  217 111  99 120  61   3  1  4.34
Warren Spahn        20  19  5  126.0  4  12  .250  140  70  61  56  35   0  0  4.36
Bob Moorhead         9   0  0   14.1  0   1  .000   16   7   7   5   5   0  0  4.40
-----------------------------------------------------------------------------------
Gary Kroll          32  11  1   87.0  6   6  .500   83  48  43  62  41   0  1  4.45
Galen Cisco         35  17  1  112.1  4   8  .333  119  63  56  58  51   1  0  4.49
Larry Bearnarth     40   3  0   60.2  3   5  .375   75  43  31  16  28   0  1  4.60
Tom Parsons         35  11  1   90.2  1  10  .091  108  53  47  58  17   1  1  4.67
Larry Miller        28   5  0   57.1  1   4  .200   66  32  32  36  25   0  0  5.02
===================================================================================
TEAM TOTALS        465 164 29 1454.2 50 112  .309 1462 752 656 776 498   6 14  4.06


ERA+  bWAR    PoY
=================
 640   0.6   9.99
 126   1.2  17.41
 118   0.9  18.58
 111   0.2   8.02
 106   0.8  23.68
-----------------
  96   0.5   6.26
  93  -0.1  12.70
  93   0.3   9.10
  
89   2.2  23.93
  90  -0.1   3.87
-----------------
  85   0.1   3.02
  83  -0.2   4.68
  81   0.0  14.98
  81   0.2  13.45
  82   0.1   1.31
-----------------
  79   0.0   9.41
  78   0.4   9.10
  77  -1.1   3.13
  75  -0.4   6.06
  70  -0.2   0.10
=================

back to Seasons - back to the New York Mets Hall of Records home page - Rounding Third baseball card shop

Coaching Staff

1965 National League Standings

1965 Opening Day Lineup

Casey Stengel, MGR
Wes Westrum, CO-MGR

Yogi Berra, CO
Don Heffner, CO
Sheriff Robinson, CO
Warren Spahn, CO

Team     W   L  PCT GB 
=======================
L A NL  97  65 .599    
S F NL  95  67 .586  2 
Pit NL  90  72 .556  7 
Cin NL  89  73 .549  8 
Mil NL  86  76 .531 11 
Phi NL  85  76 .528 11½
StL NL  80  81 .497 16½
Chi NL  72  90 .444 25 
Hou NL  65  97 .401 32 
*METS*  50 112 .309 47 

Billy Cowan, CF
Roy McMillan, SS
Johnny Lewis, RF
Ed Kranepool, 1B
Joe Christopher, LF
Charley Smith, 3B
Bobby Klaus, 2B
Chris Cannizzaro, C
Al Jackson, P

THE SEAson story

Four years into their history and the Mets took a step backward, recording their worst winning percentage since 1962, and finishing 47 games out of first place—also their worst mark since ’62.  Manager Casey Stengel was replaced by Wes Westrum mid-season, although he wasn’t so much fired as he was replaced by an injury—he got hit by a cab and was hospitalized.  Two Met pitchers were 20-game losers again; this time Al Jackson rejoined that sad party, which he had avoided since his rookie season in 1962.

But there was some cause for hope.  Rookie outfielder Ron Swoboda led the club with 19 longballs, and there were other players enjoying their first taste of big-league life who would eventually contribute much to the Mets’ success, like Bud Harrelson and Cleon Jones and Tug McGraw.

Perhaps the ugliest stat the Metsies put up in this woeful year was that they recorded only 28 stolen bases all season, but were thrown out 42 times!  Or maybe you would prefer that .277 cumulative on-base percentage, or the .221 team batting average.  Once again, these numbers could only go so low ... things would have to eventually start looking up.


 1964  ï

ð   1966